RODEO
RODEO (Rapid ORF Description & Evaluation Online) is an algorithm to help biosynthetic gene cluster (BGC) analysis, with an emphasis on ribosomal natural product (RiPP) discovery.
RODEO (Rapid ORF Description & Evaluation Online) is an algorithm to help biosynthetic gene cluster (BGC) analysis, with an emphasis on ribosomal natural product (RiPP) discovery.
The sections here primarily describe how to interface RODEO output with some handy visualization or analysis tools. We found that the following programs were particularly useful:
Note: the most helpful practice to adopt when subjecting your dataset to a variety of analyses in several different programs is to embrace the use of primary keys. A primary key is simply a unique identifier used to unambiguously identify each record and helps as an index when importing/exporting data. If you just give each peptide and each protein in your output CSVs a unique number, this can serve as the primary key.
Using Excel, counts of Pfam pHMM hits can readily be calculated for an output RODEO dataset.
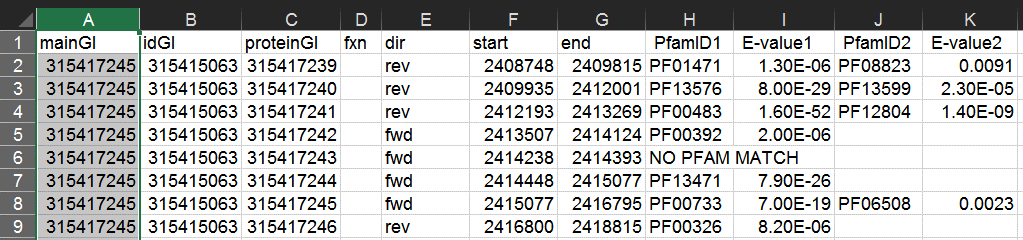
First, make sure to generate RODEO data including an output CSV (via the -csva option) to yield a list of Pfam pHMM hits. In this example we use as input knownlassos.inp, a list of lasso cyclases from numerous characterized lasso peptide biosynthetic gene clusters.
python rodeo_main.py knownlassos.txt -out known
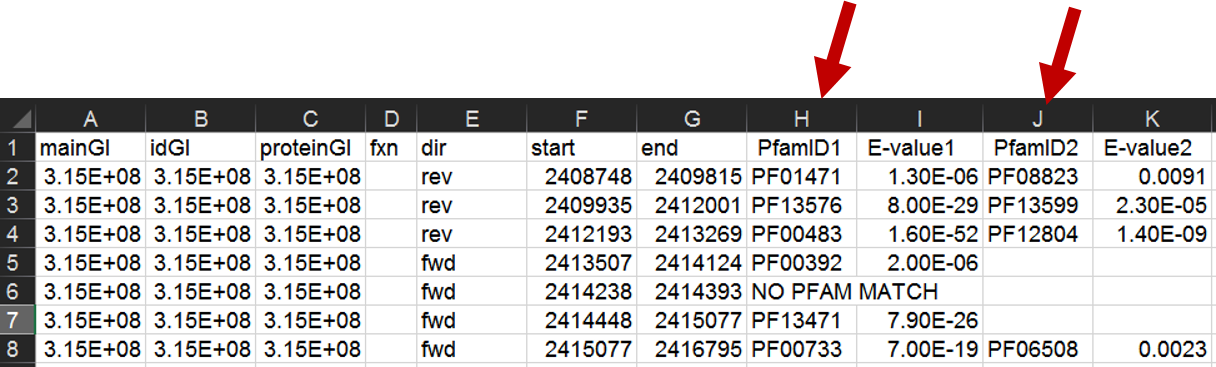
When the run has completed, open the .csv file in Excel. Select the first column containing the PFxxxxx IDs and copy these to a new worksheet. Do the same with the second column containing PFxxxxx IDs; copy this to the same worksheet, below the first set of PFxxxxx IDs.
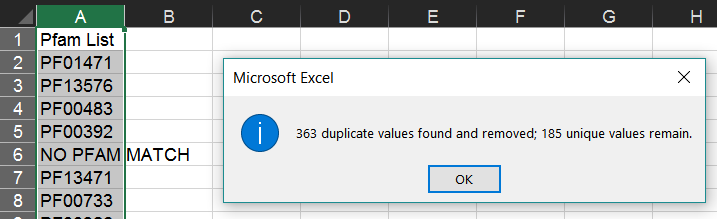
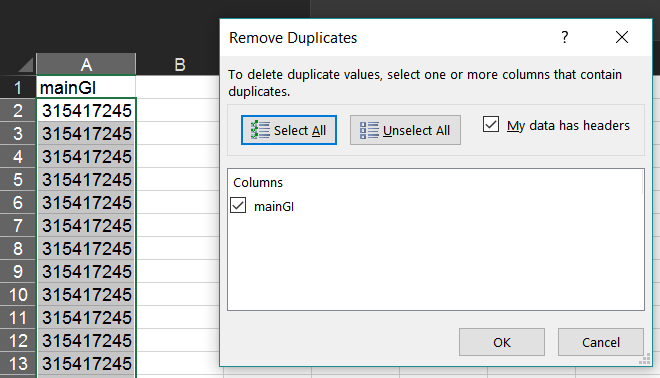
Select the list of Pfam IDs created in the last step. Then, in Excel, choose "Remove Duplicates" from the "Data" tab.
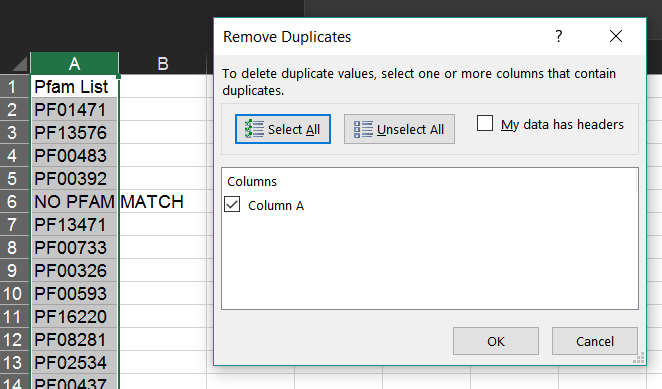
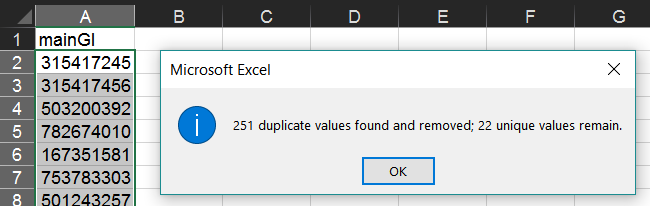
This will leave only one instance of each Pfam ID.
This is accomplished using the COUNTIF() function in Excel. For instance, assuming your Pfam list occupies cells A2:A185 in your Unique Pfams sheet, and you've named your RODEO output sheet as Output (as above), enter the following in cell B2:
=COUNTIF(Output!H:H,A2)
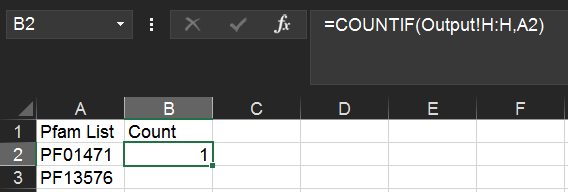
Next, copy/paste this cell into cells B3:B185 to apply the formula to all of them.
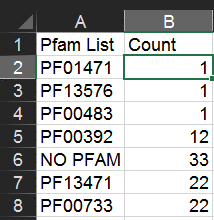
Note: the above procedure will get you the counts of the top Pfam hits. To also include second-place Pfam hits, use the following formula instead:
=COUNTIF(Output!H:H,A2)+COUNTIF(Output!J:J,A2)
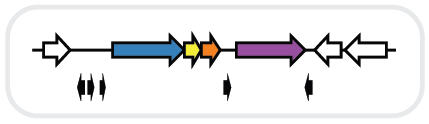
Using the output generated from the Pfam counts section, you can determine when and how frequently certain proteins co-occur within a local region.
First we'll want to determine a list of unique clusters. This is simply the collection of unique input GI/accession identifiers.
To do this, select the list of input identifiers in your protein list spreadsheet and copy them to a new worksheet.
As in the section above, in your new worksheet select the column containing this list and from the "Data" tab select "Remove Duplicates".
This will leave one GI/accession to represent each cluster.
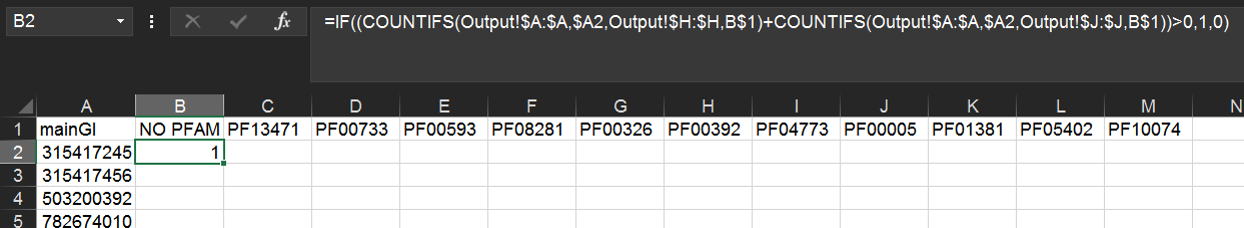
Put any Pfam IDs of interest as column heads in the first row of the Clusters sheet (here we have chosen the 12 most common Pfams as determined in our analysis of Pfam count above).
Then, assuming column A is the list of identifiers, type the following formula in cell B2:
=IF((COUNTIFS(Output!$A:$A,$A2,Output!$H:$H,B$1)+COUNTIFS(Output!$A:$A,$A2,Output!$J:$J,B$1))>0,1,0)
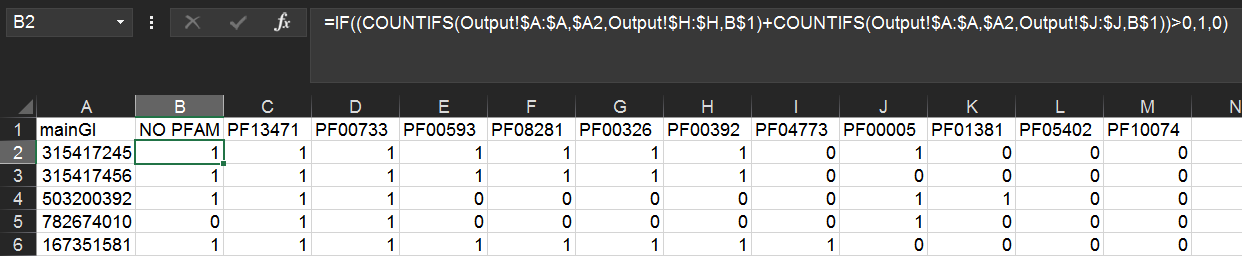
Copy/paste this formula to the remaining rows and columns. This will display 1 if the cluster contains the Pfam and 0 if it does not.
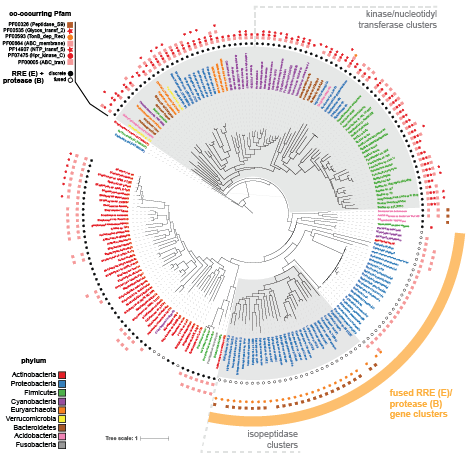
Using the output generated from the co-occurrence analysis section, you can annotate a phylogenetic tree made with iTOL in order to show co-occurring genes with icons.
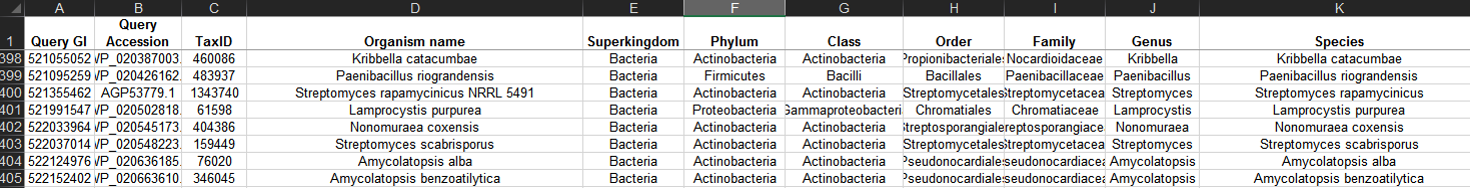
The NCBI Taxonomy database can be used to annotate RODEO output with taxonomic details of the organisms associated with proteins.
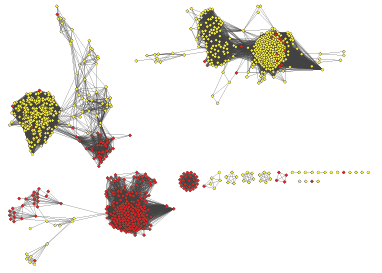
RODEO output, including co-occurrence analysis, can be imported into Cytoscape to annotate a sequence-similarity network generated with EFI-EST or BLAST (Gerlt et al., 2015). The resulting networks can then be colored to show protein/protein co-occurrence, for example.
The program Circos can be used to give information-rich overviews of a large number of gene clusters. We've found it particularly informative to annotate a Circos diagram to show the discovery status, sequence similarity, local genomic region, and taxonomy of a large group of BGCs.
Trends in amino acid composition within a set of precursor peptides can give broad insight into the selectivity of the biosynthetic enzymes as well as reveal the chemical diversity or physicochemical properties of a class of natural products. Given a set of leader, core, or whole precursor peptides, this can be accomplished in Excel.
A template Excel file that can be filled with any input data is given in the sample data.
The following is a brief run-through of how to accomplish this.
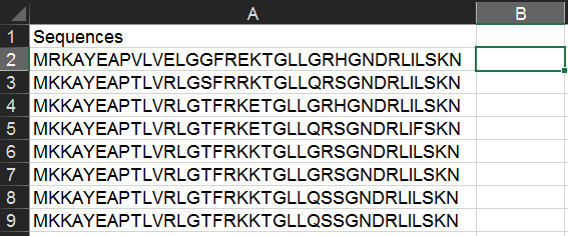
Open a spreadsheet containing in one column (here we'll use a single column, A, with citrulassin-family lasso peptide precursors, to illustrate this) a list of peptides.
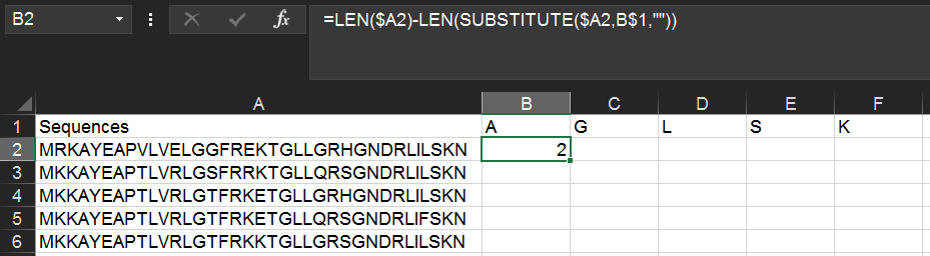
In cell B1 (the header for the second column), write the one-letter code for an amino acid of interest (here, "A"). Then in cell B2, type the following formula:
=LEN($A2)-LEN(SUBSTITUTE($A2,B$1,""))
By way of explanation, this calculates the number of a particular character in a string by comparing its full length to the length if you delete all instances of that character.
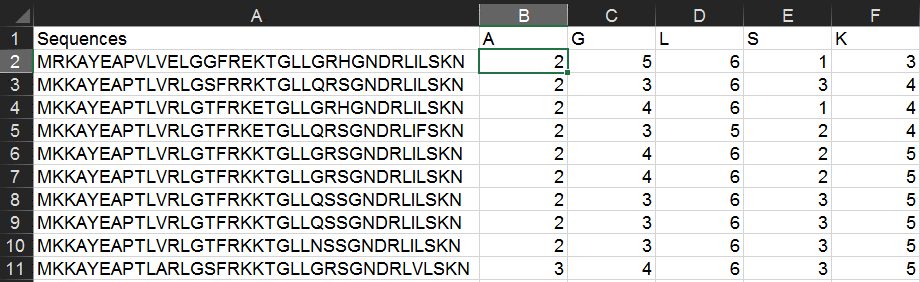
In adjacent row headers, fill in any other amino acids of interest.
It's important to use the "$" above (and in other examples)--these specify absolute rather than relative cell references and enable you to copy & paste formulas quickly. In this case, we are keeping column A constant for each row (enabling us to copy/paste to evaluate many peptide sequences), and keeping row 1 constant for each column (enabling us to copy/paste to evaluate many different amino acids). For more on absolute and relative references, read further.
Copy & paste this formula into all pertinent columns and rows. This will give the amino acid count for each peptide.
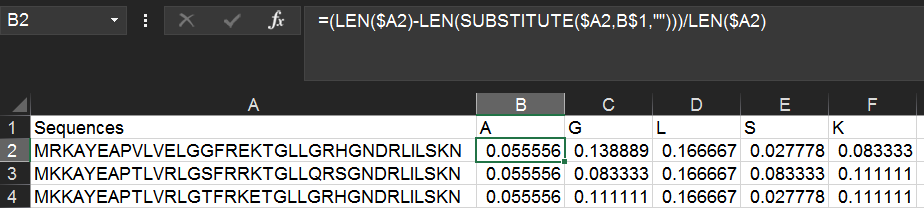
Alternatively, you can get the amino acid percentage by using the following formula instead:
=(LEN($A2)-LEN(SUBSTITUTE($A2,B$1,"")))/LEN($A2)
You use the SEARCH() function to find strict sequence motifs in the list. Wildcards (including ? and *) are useful here.
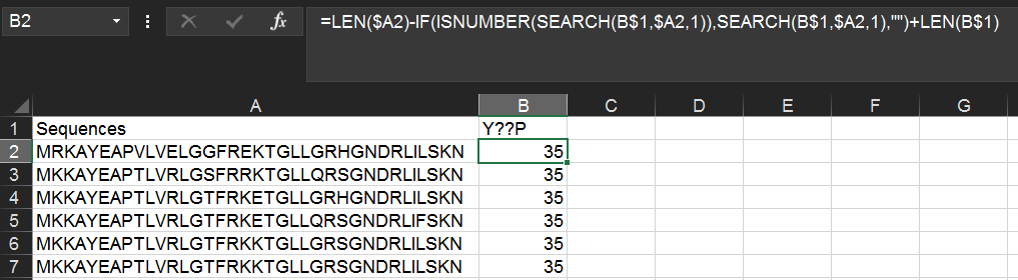
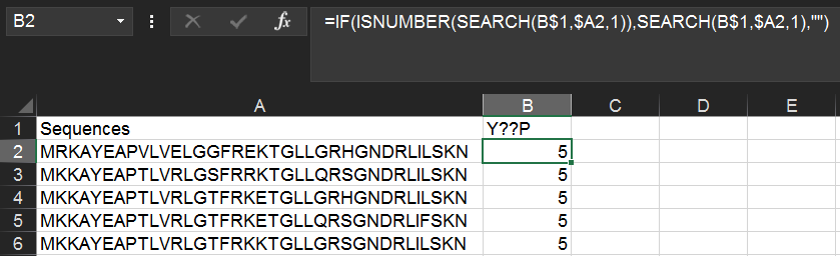
Within the same spreadsheet as above, we can use the following function to find instances of a YxxP motif (where x is any amino acid). Type Y??P into cell B1 and then the following formula into B2:
=IF(ISNUMBER(SEARCH(B$1,$A2,1)),SEARCH(B$1,$A2,1),"")
The above formula will return the numerical position of the first instance of the motif, or if the motif is not found, the cell will remain blank.
Alternatively, you can return the position relative to the end of the string with the following formula:
=LEN($A2)-IF(ISNUMBER(SEARCH(B$1,$A2,1)),SEARCH(B$1,$A2,1),"")+LEN(B$1)